Two articles in the September issue of Energy Risk Magazine raised troubling issues about the growing popularity of physical natural gas prices indices, declining number of transactions used to calculate them and growing regulatory risks that energy companies face from the FERC’s enforcement staff. Also falling liquidity at physical natural gas hubs could affect natural gas futures and swaps. These issues don’t bode well for an energy future envisioned by the Clean Energy Plan and future U.S. natural gas exports. In fact, we think that the Physical Natural Gas Markets are in big trouble and that low natural gas prices are masking the problem. We explain below why we think that the Physical Natural Gas Markets need a major remake right now and how technology can strengthen the indices.
Who Purchases Physical Natural Gas?
Physical natural gas purchasers are a diverse group consisting largely of marketers, a few banks and commercial end users. The latter are made up of gas utilities, electric utilities, independent power producers and industrial companies. These companies use natural gas to generate electricity, heat homes and businesses and as a feedstock. Growing numbers of vessels and heavy heavy trucks are using natural gas a fuel and railroads are researching LNG locomotives. Natural gas marketers dominate physical natural gas purchases as well as sales. They sell the majority of their equity natural gas production to purchasers in the bid week markets and participate in the daily market.
Despite turf battles between FERC (regulates physical natural gas) and the Commodity Futures Trading Commission (regulates futures and swaps), the natural gas markets are interrelated. Most physical natural gas purchasers and sellers hedge their risks by participating in the natural gas futures and swaps markets, especially using index and basis swaps. Although these swaps are financial instruments they rely on physical natural gas indices calculated by Platts, a Price Reporting Company. For example, basis swaps reflect the monthly index price or Platts IFERC monthly price at a location (like Transco Zone 6- NY) with the NYMEX Natural Gas Futures contract. Index swaps are also used to hedge- market participants can exchange IFERC monthly prices at a location with daily index price (Gas Daily Index).
Major Purchasers of Physical Natural Gas from 2009-2013
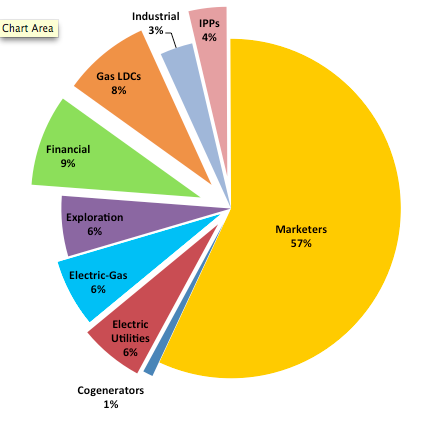
Source: Form 552 Data
Why Purchasers don’t seem to care about index formation (at least right now)
Today, its difficult to picture a scenario where commercial end user groups represented by the Edison Electric Institute, Electric Power Supply Association, American Gas Association, American Public Power Association and independent power producers would be raising hell with FERC staff about natural gas price indices. That’s simply not the case now, because physical natural gas price indices have been below $3.00/MMBtu for some time and supply is abundant. However, back in early 2006, when FERC staff held such discussions with gas market participants, those same groups were very upset with high natural gas price indices. They wanted FERC to do something about it. After all FERC together with the gas industry helped to develop a policy statement in 2003 that was based on voluntary reporting of transactions to Price Reporting Agencies (PRAs) who would calculate and publish the indices. In 2005 spot prices at the Henry Hub averaged $8.63/MMBtu and ranged between $5.53/MMBtu and $15.39/MMBtu. Also arguably more energy companies were voluntarily reporting to PRAs like Platts, Natural Intelligence (NGI), Argus Media and others than do now and FERC investigations was not likely. FERC's Office of Enforcement was still finding its way and assimilating its new penalty authority ($1 million per day) under the Energy Policy Act of 2005 and how to go about fighting market manipulation.
2005 was a Tough Year for Physical Natural Gas Purchasers
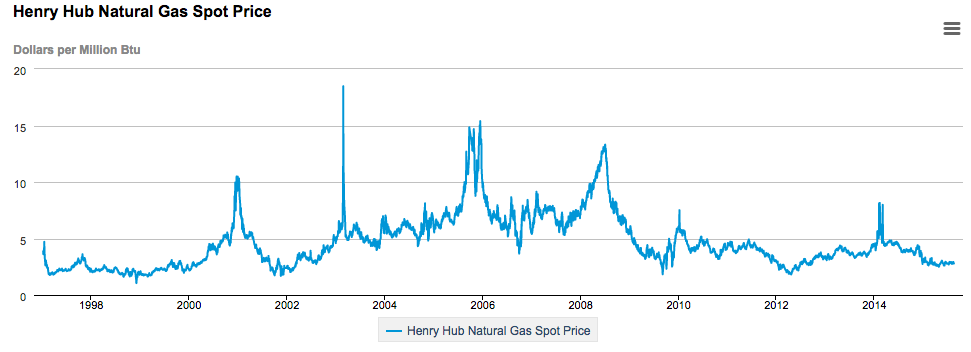
Source: Energy Information Administration
Natural Gas Index Price Formation in a Gassy and Renewable World
Increased use of natural gas in the power sector has been growing steadily for the past 10 year. EPA’s Clean Energy Plan (CEP) is counting on an abundant supply of natural gas at a reasonable price to replace all of the coal-fired power plants that will be retired. There is only one problem with this scenario—no one knows where natural gas prices will be in the next 10-15 years. We do know that natural gas prices can be very volatile and that Cheniere Energy Partners and others will be exporting natural gas via LNG vessels and cross border pipelines beginning early next year. Also the decline in oil prices is adversely affecting the rates of return on wet shale gas plays and associated gas from oil wells. As a result, the supply of natural gas may decline from those plays and put upward price pressure on the natural gas. Simply put, natural gas price may simply be higher and rain on EPA’s parade.
Power Generation Is Getting More Gassy
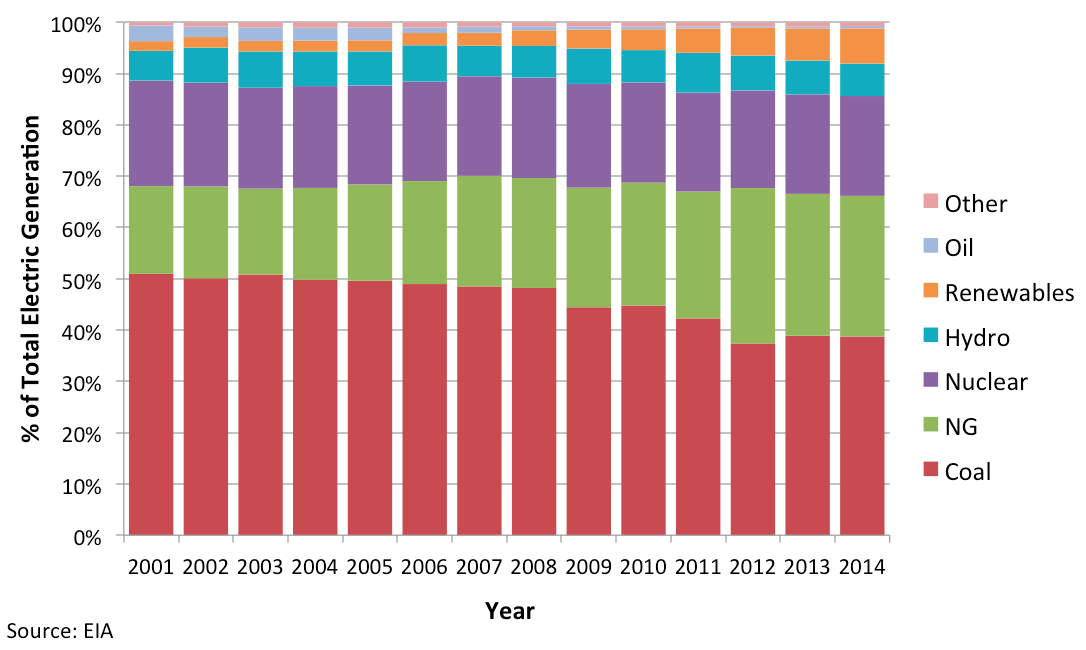
Higher natural gas prices and indices could make the Clean Energy Plan (CEP) a very expensive proposition for power generators and electricity consumers. In terms of trends, the U.S. is getting more gassy in terms of gas-fired electric generation while coal-fired power generation is declining. Some regions like the Northeast are especially reliant on natural gas as a power source. While many may blame EPA’s Mercury and Air Toxics (MATS) regulations and now the CEP for this, the relatively low price of natural gas (less than $3/MMBtu) is probably the chief reason. Most electric utilities and probably EPA and the States might have second thoughts about this if we were in a natural gas pricing environment that reflects 2005 calendar year prices that reached $15.00/MMbtu.
Another factor that can affect natural gas prices is the global economy and urban air pollution. Although the global economy is stagnating, countries like China and India have significant air pollution problems. They may also adopt Clean Energy Plans of their own and recognize the environmental benefits of natural gas compared to other fuels like coal and oil in their power sectors. This would be very bullish for domestic natural gas prices in North America and LNG exports.
Natural Gas Price Indices and Flamingoes-what they have in common
The physical natural gas prices indices are like a flock of flamingoes- pretty attractive, but only supported by a spindly leg. In today’s sub $3.00/MMBtu price environment, indices are increasingly popular and a convenient way to price natural gas with both sellers and purchasers according to FERC Form 552 Annual Reports of Natural Gas Transactions. The time window for transactions used to calculate indices is narrow by design. For example, Daily Natural Gas Price Indices are based only on gas nominated by 11:30 a.m. Central Prevailing Time for next day delivery. Monthly Natural Gas Price Indices are based on Fixed Price next month delivery transactions conducted during bid week, which is the last 5 business days of the month.
Like the legs of a flamingo, the volumes of gas transactions that are used to support an index are relatively small compared to the volumes of gas where index prices are used. Bear in mind that not all flamingoes or gas price indices are equal either. Some flamingos and trading sites are larger and have stronger legs or greater liquidity reflected by greater trading volumes, large numbers of buyers and sellers, and a large number of deals. PRAs like Platts, Natural Gas Intelligence and the IntercontinentalExchange provide this information for all natural gas indices every day so market market participants can decide on what indices to use. Interstate natural gas pipelines use the indices to calculate cashouts and imbalances as well.
Why there is a Problem
Natural gas price index formation is in trouble, because the transactions used to calculate them a steadily declining. Today's index forming transactions are voluntarily provided by a few large companies-- BP Energy, Shell Energy N. America, ConocoPhillips, Mcquarie Energy, Tenaska Marketing, Chevron USA, and BG Energy Merchants. Without the marketers, natural gas price indices would suffer. Also if only one or two companies are voluntarily reporting index forming transactions at a trading site, it is much more easier to move index prices and manipulate markets.
It’s pretty well acknowledged that if a company like BP Energy and other top marketers decided to stop voluntarily reporting their transactions to PRAs that index formation and price discovery would suffer. Marketers really make the system work. However, most of the other major purchasers do nothing to support index formation. They simply take advantage of and use indices, but don’t contribute to their formation. As mentioned above, in a sub $3.00/MMBtu environment this works well. But if natural gas prices become bullish, then index users and their customers will suffer. The largest gas local distribution company, AGL Resources, does not voluntarily report transactions, but are large users of indices to price gas. Banks, electric utilities, and independent power producers are also large users of indices but don’t help to form them.
While natural gas marketers provide price discovery and index forming transactions, they have little to show for it. However, the fact the they report index forming transactions has nothing to do with why they are the subject of FERC’s Enforcement investigations and routine audits. FERC simply has not initiated an investigation because a company made an error in reporting transactions to a PRA or filing an incorrect Form 552 report. However, if there is there is a manipulation investigation, a company that voluntarily reports must also deal with the fact that they are contributing to index formation too. Recently, companies like Total Gas & Power have stopped voluntary reporting to avoid this conundrum.
Fixing the Index Formation Problem
The natural gas markets and pipeline transportation systems have enabled the Shale Gas Revolution in North America. However, we believe its is time to jettison the voluntary reporting model that FERC released and clarified almost 12 years ago and replace it with a system that captures the majority of index forming deals executed on in the physical natural gas markets. No one can predict with certainty the future price of natural gas. However, we can do something that makes the natural gas indices much stronger than they are now by automatically capturing index forming deals by a majority of market participants, not just a few large natural gas marketers. Such a system would improve liquidity for all 132+ sites where physical gas is traded in North America and reflect broad market fundamentals. In fact, when we think of equity markets and the Dow Jones Industrial Average, S&P 500 and other popular indices, we realize that there are systems on the electronic trading platforms that automatically capture these trades and are used to calculate these indices.
Since 2003, electronic trading of physical natural gas has grown tremendously. The IntercontinentalExchange (ICE) claims that 80-85% of the physical natural gas trading in the U.S. is done on their electronic trading platform, while the Natural Gas Exchange (NGX) accounts for most physical natural gas trading in Canada. Fortunately during this time, technology and Commodity Trading & Risk Management (CTRM) software have made significant progress in the market place. Many natural gas sellers and purchaser are use CTRM software to manage their trading desks and gas procurement. Today, software like Ensyte’s GASTAR Contracts Module and provides a comprehensive contracts management tool to both sellers and purchasers of gas to manage gas supply, transportation, and retail business relationships. The feature supports contracts for transportation, storage, physical exchange, market trading (ICE), asset management, retail marketer pooling, and more, with NAESB compliant functionality for master purchase and sales contracts. [Disclosure: we are not affiliated with Ensyte].
If CTRM software like Ensyte's GASTAR Contracts Module are part of the ICE physical natural gas trading platform, then all index forming transactions executed by any market participant that buys and sells physical natural gas would be captured and used to calculate an index. Voluntary reporting would no longer be an issue or for that matter a cost that a reporting company would have to bear. For example, today NRG or AGL Resources don't voluntarily report their purchases physical natural gas that could contribute to index formation. If the ICE or similar electronic platform has CTRM software, then both NRG's and AGL Resources' index forming transactions would be automatically captured and be used by ICE's system to calculate indices. The issue of voluntary reporting is no longer relevant. However, using NRG's and AGL Resources' transactions to calculate indices would be addressed by the Terms of Use of the ICE or other trading platform. The result would be indices based on index forming deals transacted by all or the majority of market participants at no cost to the companies trading on the ICE platform or similar platform. The end result would be increased price transparency and discovery in North American gas markets. In addition, index and basis swaps would also benefit from the increase liquidity and above changes.
Cybersecurity and Natural Gas Markets
Natural gas futures and swaps markets are massive compared to the North American physical natural natural gas markets. If the physical natural gas markets were to take advantage of CTRM software as discussed above, then ICE and NGX should ensure that their electronic trading platforms have robust cybersecurity and that transactional data are protected to the same degree that natural gas and oil futures and swaps are protected. Given that the U.S. energy future will rely heavily on well functioning physical natural gas markets, it's important that these markets receive comparable protection, remain competitive and are free of manipulation, irrespective of where price levels are in the next 10 years.
Resources
The two September 2015 Energy Risk Magazine articles may be accessed at:
- Fall in U.S. gas hub liquidity hampers derivatives market
http://www.risk.net/energy-risk/news/2421660/fall-in-us-gas-hub-liquidit... - U.S. gas price reporting drop raises questions about indexes
http://www.risk.net/energy-risk/feature/2421133/us-gas-price-reporting-d...